Effective Gross Income Multiplier and Net Income Multiplier: The Steps Past GRM
The effective gross income multiplier and the net income multiplier sit one rung above GRM. How each is built, what it fixes, and which one your data supports.
By the GRMCalculator.com team
The effective gross income multiplier is price divided by effective gross income: the rent a property actually collects, plus other income, after vacancy and bad debt. The net income multiplier is price divided by net operating income, and it is the capitalization rate turned upside down. Both are rungs above the gross rent multiplier on one ladder, and the gross income multiplier method sits in between. If the bottom rung is still new, start with how to value a rental with gross rent multiplier. This guide covers what that overview leaves out: how each rung above it is built, what each one fixes, and which one your data supports.

Coursework and appraisal reports tend to introduce all four at once, which makes them look like competing formulas. They are not. They are one ratio measured at four lines of the same income statement.
Four multipliers, one ladder
| Multiplier | Formula | Income line it uses |
|---|---|---|
| GRM | Price / gross scheduled rent | Rent only, as if fully occupied |
| GIM | Price / gross income | Rent plus other income |
| EGIM | Price / effective gross income | After vacancy and collection loss |
| NIM | Price / net operating income | After operating expenses |
Each step down brings the denominator closer to money the owner keeps. Each step also needs a figure that is harder to verify, for the property you are buying and for the sales you measure it against. That tradeoff is the whole choice. All four belong to the income approach, which is where an appraisal report files them.
From gross rent to effective gross income
Take the standard example on this site. A $500,000 rental renting for $4,000 a month collects $48,000 a year, so the gross rent multiplier is about 10.4. With only an annual figure, the simple version works the same way: $500,000 on $50,000 of annual rent is a GRM of 10.
Now treat that property as a small building with a coin laundry and two storage lockers bringing in $1,200 a year. Gross income becomes $49,200, and the gross income multiplier is $500,000 divided by $49,200, about 10.2. The multiplier fell because the denominator grew, not because the property got cheaper. The guide on rent only or all income shows when that difference changes a decision.
Next, take out the units that sit empty. Allow 5% of scheduled rent for vacancy and collection loss, or $2,400. Effective gross income is $48,000 minus $2,400 plus $1,200, which is $46,800. The effective gross income multiplier is $500,000 divided by $46,800, about 10.7.
The right allowance depends on the market. Tight submarkets lose a point or two of rent, while places with heavy turnover can lose high single digits. Use what similar buildings nearby actually recorded over the last year or two. The metro pages show how differently local markets price rent to begin with.
What the effective gross income multiplier fixes
GRM cannot see an empty unit. Two buildings with the same price and the same scheduled rent carry the same GRM whether one runs at 97% occupancy or the other at 88%. The buyer of the second one is paying for rent that never arrives.
EGIM closes that gap. Hold the example’s price and push the loss from 5% to 10%, and effective gross income falls from $46,800 to $44,400. The EGIM moves from 10.7 to 11.3. Same building, same asking price, worse collections, and the multiple being paid is more than half a point higher.
The catch is that EGIM only helps if you can build the same figure for the comparable sales. A listing quotes scheduled rent. Actual collections come out of a rent roll and bank statements, which usually means you are past screening and into due diligence.
The net income multiplier and its mirror image, the cap rate
Keep going down the statement. Subtract operating expenses, taxes, insurance, management, repairs and reserves, and you reach net operating income. Price divided by NOI is the net income multiplier. Divide the other way and you have the cap rate. Each one is 1 divided by the other.
Give the example a 35% operating expense ratio on effective gross income, a normal range for a small residential building where tenants pay their own utilities. Expenses come to $16,380 and NOI to $30,420. The net income multiplier is $500,000 divided by $30,420, about 16.4. The cap rate is $30,420 divided by $500,000, about 6.1%. One divided by 16.4 is 6.1%, as it should be.
The two rungs are tied by one line: cap rate equals one minus the operating expense ratio, divided by the EGIM. Here that is 0.65 divided by 10.7, or 6.1%. Read it backwards and you can see how gross multipliers mislead. Two buildings at an EGIM of 10.7 produce a 6.1% cap rate at a 35% expense ratio and a 4.7% cap rate at a 50% ratio. Same gross multiple, roughly a quarter less net income.
That is the short answer on gross income multiplier versus capitalization rate. The multiplier is fast and runs on numbers a listing hands you. The cap rate prices the income. When the shortcut is safe covers how large the error tends to get.
Which rung fits the data you actually have
GRM
Screening, one to four units, plenty of comparable sales, and nothing in hand but asking rent.
GIM
The gross income multiplier method is best used to value small income property where the comps collect a similar mix of income and carry similar expense ratios. Where parking or laundry is a real share of the total, GIM beats GRM.
EGIM
When you have a rent roll and a vacancy history for the subject and the comps. Common in appraisal work on small apartment buildings, because an appraiser can usually get both halves.
NIM
Five or more units, or any decision that turns on more than 10%. Most buyers quote the cap rate instead, which is the same measurement in the form the market speaks.
Worked example on one small apartment building
| Income line | Amount | Multiplier at $500,000 |
|---|---|---|
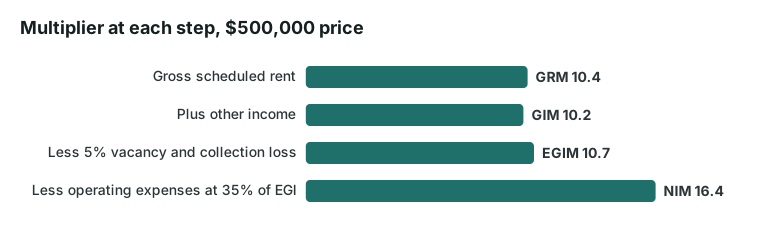
| Gross scheduled rent | $48,000 | GRM 10.4 |
| Plus other income | $49,200 | GIM 10.2 |
| Less 5% vacancy and collection loss | $46,800 | EGIM 10.7 |
| Less operating expenses at 35% of EGI | $30,420 | NIM 16.4 |
The price is $500,000 on every line. Read down the right column and you learn something the first number could not say: the price is 10.4 years of asking rent, or 16.4 years of net income. If comparable sales nearby trade at a net income multiplier of 16, the same NOI supports $486,720, about 3% under the asking price. The gross multiplier never surfaces that gap, because it never sees the expenses.

Start at the bottom rung
Most decisions never need the top of this ladder. Screen on gross rent, and climb only when the money at stake justifies the paperwork. The GRM Calculator on the home page handles the bottom rung on whichever input you have, monthly or annual rent, and shows the price a given rent supports at a market multiple. Build the rungs above it on the deals that survive the first cut.
Frequently asked questions
What is the effective gross income multiplier?
It is price divided by effective gross income. Effective gross income starts with scheduled rent, subtracts an allowance for vacancy and collection loss, then adds other income such as laundry, parking and storage. Because that denominator is smaller than full scheduled rent, the EGIM usually comes out higher than the same property's gross rent multiplier. It is the first rung that accounts for empty units.
What is the net income multiplier?
The net income multiplier is price divided by net operating income, so it tells you how many years of net income the buyer paid for. It is the reciprocal of the capitalization rate. A 6.1% cap rate is a net income multiplier of about 16.4, because one divided by 0.061 is 16.4. Appraisers usually quote the cap rate, but it is the same measurement.
What is the difference between the gross income multiplier and the capitalization rate?
The gross income multiplier measures price against income before expenses. The cap rate measures net income against price after expenses. The two are linked: one minus the operating expense ratio, divided by the effective gross income multiplier, gives the cap rate. So two buildings can share a multiplier and still have very different cap rates if their expense ratios differ.
What is the gross income multiplier method best used to value?
Small income property where the comparable sales share a similar income structure and similar operating expense ratios, and where gross figures are disclosed but expense records are not. One to four unit rentals fit well. The method breaks down on larger buildings, on properties with unusual costs such as owner-paid heat, and wherever the comps collect a different mix of other income.